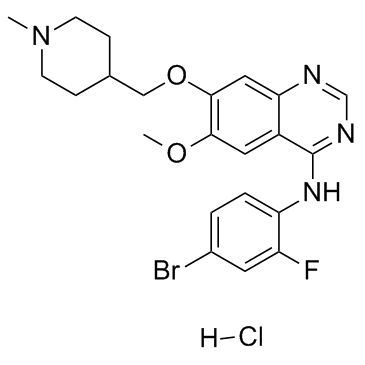
524722-52-9
| Name | Vandetanib hydrochloride |
|---|---|
| Synonyms |
N-(4-Bromo-2-fluorophenyl)-6-methoxy-7-[(1-methyl-4-piperidinyl)methoxy]-4-quinazolinamine hydrochloride (1:1)
N-(4-Bromo-2-fluorophenyl)-6-methoxy-7-[(1-methylpiperidin-4-yl)methoxy]quinazolin-4-amine hydrochloride (1:1) TCMDC-123476 4-quinazolinamine, N-(4-bromo-2-fluorophenyl)-6-methoxy-7-[(1-methyl-4-piperidinyl)methoxy]-, hydrochloride (1:1) Vandetanib (hydrochloride) |
| Description | Vandetanib hydrochloride is a potent inhibitor of VEGFR2 with IC50 of 40 nM. |
|---|---|
| Related Catalog | |
| Target |
VEGFR2:40 nM (IC50) |
| In Vitro | Vandetanib inhibits VEGFR3 and EGFR with IC50 of 110 nM and 500 nM, respectively. Vandetanib is not sensitive to PDGFRβ, Flt1, Tie-2 and FGFR1 with IC50 of 1.1-3.6 μM, while almost has no activity against MEK, CDK2, c-Kit, erbB2, FAK, PDK1, Akt and IGF-1R with IC50 above 10 μM. Vandetanib inhibits VEGF-, EGF- and bFGF-stimulated HUVEC proliferation with IC50 of 60 nM, 170 nM and 800 nM, with no effect on basal endothelial cell growth. Vandetanib inhibits tumor cell growth with IC50 of 2.7 μM (A549) to 13.5 μM (Calu-6)[1]. Odanacatib is a weak inhibitor of antigen presentation, measured in a mouse B cell line (IC50=1.5±0.4 μM), compared to the Cat S inhibitor LHVS (IC50=0.001 μM) in the same assay. Odanacatib also shows weak inhibition of the processing of the MHC II invariant chain protein Iip10 in mouse splenocytes compared to LHVS (minimum inhibitory concentration 1-10 μM versus 0.01 μM, respectively)[2]. Vandetanib suppresses phosphorylation of VEGFR-2 in HUVECs and EGFR in hepatoma cells and inhibits cell proliferation[4]. |
| In Vivo | Vandetanib (15 mg/kg, p.o.) has a superior anti-tumor effect than gefitinib in the H1650 xenograft model, and suppresses tumor growth with IC50 of 3.5±1.2 μM[3]. In tumor-bearing mice, vandetanib (50 or 75 mg/kg) suppresses phosphorylation of VEGFR-2 and EGFR in tumor tissues, significantly reduces tumor vessel density, enhances tumor cell apoptosis, suppresses tumor growth, improves survival, reduces number of intrahepatic metastases, and upregulates VEGF, TGF-α, and EGF in tumor tissues[4]. |
| Cell Assay | Growth inhibition is measured by a modified MTT assay. Briefly, the cells are plated on 96-well plates at a density of 2000 cells per well and exposed to each gefitinib or vandetanib for 72 h. Each assay is performed in triplicate. The 50% inhibitory concentration (IC50) of each drug is determined as the mean±standard deviation (SD). |
| Animal Admin | One million H1650 cells or H1650/PTEN cells (H1650 cells with a transfected PTEN gene) are injected subcutaneously into the backs of each mouse. On 10th day after injection, mice are randomLy assigned to three groups, which receive either vehicle, vandetanib (15 mg/kg/day), or gefitinib (15 mg/kg/day). Vehicle, vandetanib, and gefitinib are administered once per day p.o., five times per week. Tumor volume (width×width×length/2) and body weight are determined periodically. Tumor volumes are expressed as mean±SD. Differences in tumor volume are evaluated using Student's t-test. |
| References |
| Molecular Formula | C22H25BrClFN4O2 |
|---|---|
| Molecular Weight | 511.815 |
| Exact Mass | 510.083344 |
| Storage condition | 2-8℃ |
