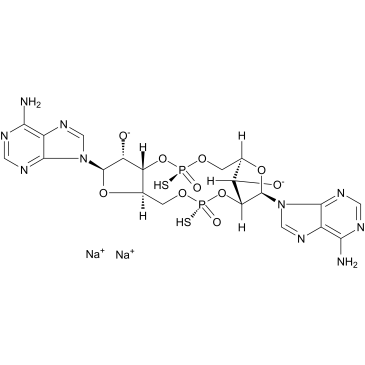
ADU-S100 disodium salt
Modify Date: 2024-01-06 18:26:26

ADU-S100 disodium salt structure
|
Common Name | ADU-S100 disodium salt | ||
|---|---|---|---|---|
| CAS Number | 1638750-95-4 | Molecular Weight | 734.51 | |
| Density | N/A | Boiling Point | N/A | |
| Molecular Formula | C20H22N10Na2O10P2S2 | Melting Point | N/A | |
| MSDS | N/A | Flash Point | N/A | |
Use of ADU-S100 disodium saltADU-S100 disodium salt is an activator of stimulator of interferon genes (STING). |
| Name | ADU-S 100 |
|---|---|
| Synonym | More Synonyms |
| Description | ADU-S100 disodium salt is an activator of stimulator of interferon genes (STING). |
|---|---|
| Related Catalog | |
| Target |
STING[1] |
| In Vitro | ADU-S100 shows enhanced type I IFN production over CDA in THP-1 human monocytes. In contrast, the dithio, mixed-linkage cyclic dinucleotide (CDN) derivatives (ML RR-CDA, ML RR-S2 CDG, and ML RR-S2 cGAMP) potently activate all five hSTING alleles, including the refractory hSTINGREF and hSTINGQ alleles. ADU-S100 induces the highest expression of IFN-β and the pro-inflammatory cytokines TNF-α, IL-6, and MCP-1 on a molar equivalent basis, as compared to endogenous ML cGAMP and the TLR3 agonist poly I:C. ADU-S100 is also found to induce aggregation of STING and induce phosphorylation of TBK1 and IRF3 in mouse bone marrow macrophage (BMM). ADU-S100 induces significantly higher levels of IFN-α when compared to ML cGAMP[1]. |
| In Vivo | ADU-S100 shows higher anti-tumor control than the endogenous ML cGAMP. A dose response of the ADU-S100 compound is performed in B16 tumor-bearing mice, which identifies an optimal antitumor dose level that also elicites maximum tumor antigen-specific CD8+ T cell responses, and improves long-term survival to 50%[1]. |
| Cell Assay | Cryopreserved hPBMCs are thawed and 1×10⁶ cells per well are plated in a 96 well plate in RPMI media supplemented with 10% FBS, 1% non-essential amino acids, 1% penicillin/streptomycin, L-glutamine, 10 mM HEPES buffer, 1 mM Sodium Pyruvate, 0.055 mM β-ME at 37°C with 5% CO2. Cells are stimulated with 10 μM ADU-S100 or ML cGAMP for 6 hours and supernatants are harvested. Supernatants are diluted 1:2 and assayed for IFN-α protein using Cytometric Bead Array (CBA) Human Flex Set. Data is collected using a FACSVerse cytometer and analyzed by FCAP Array Software[1]. |
| Animal Admin | Mice[1] WT C57BL/6 mice are inoculated with 5×10⁴ B16.F10 cells in the left flank (n=8). When tumor volumes are 100 mm3 mice receive three IT doses of either ML RR-S2 CDG (25 μg), ADU-S100 (50 μg), or HBSS as control. WT C57BL/6 mice are inoculated with 5×10⁴ B16.F10 cells in the left flank (n=5). When tumor volumes are 100 mm3 they received three IT doses of ADU-S100 at 5, 25, 50 or 100 μg or HBSS as control. WT C57BL/6 mice are inoculated with 5×10⁴ B16.F10 cells in the left flank (n=8). When tumor volumes are 100 mm3 they receive three IT doses of 100 μg ADU-S100 or HBSS as control. Treatments are administered on days 13, 17 and 20 and tumor measurements are taken twice weekly. Results are shown as percent survival by Log-rank (Mantel-Cox) test (A and C)[1]. |
| References |
| Molecular Formula | C20H22N10Na2O10P2S2 |
|---|---|
| Molecular Weight | 734.51 |
| Storage condition | -20°C |
| Adenosine, [P(R)]-5'-O-[(R)-hydroxymercaptophosphinyl]-P-thioadenylyl-(2'→5')-, cyclic nucleotide, sodium salt (1:2) |
| MIW 815 |