| Structure | Name/CAS No. | Articles |
|---|---|---|
 |
Piroxicam
CAS:36322-90-4 |
|
 |
Erythromycin
CAS:114-07-8 |
|
 |
Clotrimazole
CAS:23593-75-1 |
|
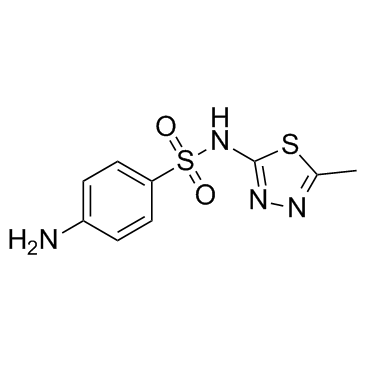 |
Sulfamethizole
CAS:144-82-1 |
|
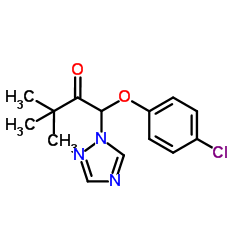 |
Triadimefon
CAS:43121-43-3 |
|
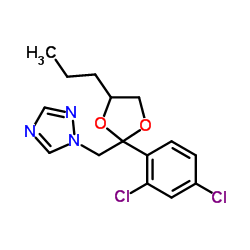 |
propiconazole
CAS:60207-90-1 |
|
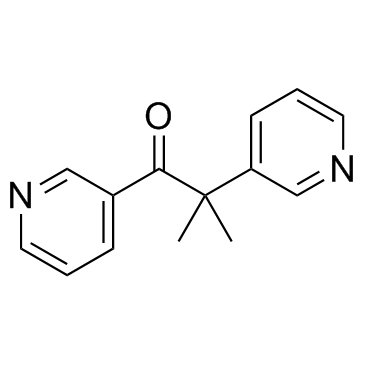 |
metyrapone
CAS:54-36-4 |
|
 |
Ketoconazole
CAS:65277-42-1 |
|
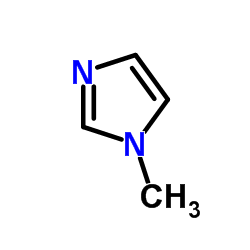 |
methylimidazole
CAS:616-47-7 |
|
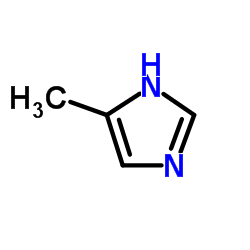 |
2-Methylimidazole
CAS:693-98-1 |